Introduction
Smart cities make evidence-based decisions based on, among others, sensors installed in the city. As government data and policy decisions world-wide, such as open by default, the freedom of information act or the public sector information directive, this data must be made freely available to everyone. In the case of sensor data, not only the live values are important, also historical values need to be preserved and made available. When historic values of smart city datasets become available, everyone can join an evidence-based debate on the city’s future.
The first traffic light was installed in London in 1868. Today, Traffic Control Systems (TCS) do not differ much from the model installed 1.5 centuries ago, yet we can imagine the potential of making TCSs internet-connected and making traffic light statuses available as Open Data. Not only self-driving cars may benefit, also cyclists seeking green lights on a rainy day, or a citizen willing to analyze the crossroad’s efficiency near their home. In the Netherlands, hundreds of these TCSs are already converted through the public-private coorporation Talking Traffic. A centralized approach using asynchronous messaging is implemented with the Traffic Live Exchange (TLEX) system which distributes data between TCSs and the end-user in both directions. The data so far has not been published publicly, but only been made available in partner applications for end-users. In the city of Antwerp (Belgium), one geographical zone is accommodated with different kinds of sensors to conduct experiments, such as the publication of its traffic lights data that is described in this paper.
Traffic lights data standards are already created by the European Telecommunications Standards Institute (ETSI), yet identifiers are scoped to the intersection, region or country. With Linked Data (Section 2), traffic light streams may become interoperable worldwide and may allow for a decentralized data publishing strategy. This way, any client, whether it is a route planners, a self-driving car or a data analyst, can follow links to and from other datasets while querying.
Preserved data from among others these TCSs can be used by digital scholars, citizens, journalists, and city officials… to study the city’s digital pulse. Such Web archives are already used by scholars in, among others, the social sciences and humanities for studying phenomena [1]. In this paper, we propose a publishing strategy for data from TCSs, and zoom in on the aspect of preservation.
The state of the art is described in Section 2. In Section 3, we propose a method how these archives also can preserve sensor observations and allow linking from the Open Data publisher to the archive. Next, an end-user application with code-snippet is demonstrated in Section 4. Finally, we discuss our conclusions in Section 5.
Background
Preservation
Digital content can be preserved on long-term on tape or on disk storage. In general, tape is used by TV broadcasters or audiovisual archives, because of its low pricing for big volumes (>50 terabytes). A tape drive is cost-effective when writing or reading large files, because the position of the tape drive reader does not need to be moved frequently contrary to small files. This deficit is solved by either bundling small files together (e.g. zip, tar) or saving them on disk storage. The latter benefits over tape with faster search and retrievable times and the ability to preserve small files more efficiently.
To archive a document, this is traditionally done by generating a hash (e.g. MD5) of the document, copying the document together with a metadata file containing the hash (cfr. sidecar) to the archive system and verify the content by regenerating the hash on the archive.
Resource Description Framework
The Resource Description Framework (RDF) is a graph-based model to describe statements. Every RDF statement corresponds with a triple (subject-predicate-object): the subject is a resource that something is said about. The subject is related to an object through a predicate. For example, ‘the traffic light is lighted green’: ‘the traffic light’ is the subject, ‘green’ is the object and ‘is lighted’ is the predicate that expresses the relation.
Memento TimeMaps
Memento [2] is a HTTP framework that allows a client to retrieve a time specific version (called a Memento) of an Original Web resource that exists or used to exist. One of the techniques to do this is by retrieving a TimeMap that describes a list of Mementos of the Original Web resource with its valid timestamps.
Linked Data Fragments
Linked Data Fragments [3] is a conceptual framework that allows to compare Linked Data Web interfaces (a datadump, SPARQL-endpoint, subject page…) by describing how they publish fragments of their RDF datasets. Such a Linked Data Fragment consists of three parts:
- a selector defines which parts of the datasets belong to a fragment. For example: only sensor observations that are generated between a certain time interval.
- metadata about the fragment. For example: the license that is applied.
- controls help clients to retrieve more relevant data. For example: where a previous page of a paged collection can be found.
The Linked Data Fragments axis shows a uniform view over the trade-offs (caching, bandwidth etc.) that these Web interfaces bring in respect to the client and server effort. For instance, an interface that offers a datadump requires a higher effort from the client than the server, because the client needs to download the whole dataset before it can solve its task.
Comunica [4] is a framework to query over the various Web interfaces in the Linked Data Fragments axis. It interprets the metadata and controls to evaluate a query. Finding a fragmentation strategy [5] for Web archives and time series data that can be consumed by generic clients [6] is still a challenge. In this paper we try to suggest a solution in which generic clients can still query over the data.
Open Traffic Lights
The Open Traffic Lights project started from the need to publish the traffic lights data in the Smart Zone in Antwerp as Open Data. By using the Resource Description Framework (RDF) as a common model for representing knowledge, sensor observations are syntactically interoperable without necessarily having to support the same serialization. To enable this for traffic lights observations, an ontology is needed to describe the signal phase and timing and how traffic can move over the intersection.
The map data describing the cross road and the signal phase and timing of the traffic control messages are available through a closed message broker (cfr. MQTT) with a frequency of 200 milliseconds which corresponds with the cycle time of the Traffic Control System of the intersection. In the specification section, we will describe how the number of data messages can be optimized for Open Data publishing and how historical information is still retrievable, in contrast to the broker interface.
The ontology is based on two Flemish profiles: the MapData (MAP) and the Signal Phase and Timing (SPAT) profile. While MAP focuses on describing the topology of an intersection, SPAT describes the timing of the phase that a traffic light adheres to. Both profiles conform to European Telecommunications Standards Institute (ETSI) standards: ETSI 103 301, ETSI TS102 894-2, but are not publicly available.
Ontology
The Open Traffic Lights ontology is currently scoped to the data that is published by the Smart Zone. It is publicly available under an Open license: https://w3id.org/opentrafficlights# with prefix otl. Fig. 1 shows an overview of all the supported classes and properties that are defined.

Fig. 1: Classes and properties for describing MAP/SPAT related knowledge.
According to the driving direction of the road user, the lane otl:Lane that goes towards the conflict area of the intersection is described with a otl:departureLane, mutatis mutandis for the otl:arrivalLane. If a road user can travel from a departure lane towards an arrival lane, than this is called a otl:Connection.
Travel is possible according to the otl:SignalState of the traffic light. Instead of referring to a traffic light, the SPAT profile coins the term otl:SignalGroup for the collection of traffic lights that continuously share a signal state. The latter is characterized by the following relations:
- otl:signalPhase: points to a SKOS concept that represents the signal phase (stop and remain, movement allowed, unavailable…). As a result of this phase, the traffic light shows a color (green, orange flashing, etc.).
- otl:minEndTime: the earliest time that the signal phase will change.
- otl:maxEndTime: the maximum time that the signal group will remain in this signal phase.
In the SPAT profile, the signal phase is described using a text field, e.g. “protected-Movement-Allowed”, which means that a road user can safely cross the intersection (a green light). To allow semantic interoperability with foreign countries, we made a taxonomy of possible signal phases which can be dereferenced by HTTP clients. The taxonomy is publicly available at https://w3id.org/opentrafficlights/thesauri/signalphase under an Open license.
In next section, we will describe a Web Application Programming Interface specification to publish traffic light observations for Open Data re-use.
Specification
The specification contains three aspects:
- how every traffic light observation must be described,
- how the server interface exposes the live observations,
- how historical observations must be published
A data publisher must publish observations with instantaneous graphs (iGraphs) [7] which represent a part of the traffic lights stream. This iGraph is a named graph that annotates one or more observations with a time stamp. A publisher must use prov:generatedAtTime to indicate the iGraph’s timestamp. Fig. 2 shows an iGraph https://opentrafficlights.org/spat/K648?time=2018-10-31T14:58:23.205Z that contains the signal phase and timing of signal group https://opentrafficlights.org/id/signalgroup/K648/6. The iGraph should be extended with the Sensor, Observation, Sample, and Actuator [8] (SOSA) ontology to semantically describe an observation with its result, observed property etc.
<https://opentrafficlights.org/id/signalgroup/K648/6> a otl:SignalGroup.<https://opentrafficlights.org/spat/K648?time=2018-10-31T14:58:23.205Z> {<https://opentrafficlights.org/id/signalgroup/K648/6> otl:signalState _:b0._:b0 a otl:SignalState;otl:signalPhase <https://w3id.org/opentrafficlights/thesauri/signalphase/0>;otl:minEndTime "2018-10-31T14:58:37.605Z"^^xsd:dateTime;otl:maxEndTime "2018-10-31T14:59:40.605Z"^^xsd:dateTime.}<https://opentrafficlights.org/spat/K648?time=2018-10-31T14:58:23.205Z>prov:generatedAtTime "2019-02-14T17:43:54.297Z"^^xsd:dateTime.
Fig. 2: Example of an iGraph https://opentrafficlights.org/spat/K648?time=2018-10-31T14:58:23.205Z which time annotates the state of a signal group. The state _:b0 links to a phase (https://w3id.org/opentrafficlights/thesauri/signalphase/0) and is constrained with a time interval when it will end.
SPAT messages are sent every cycle time of a Traffic Control System. For the TCS in Antwerp, which has a cycle time every 200 ms, this corresponds with 5 iGraphs per second. For our use case whole second resolution suffices as we want to show a live count-down based on seconds. To lower the number of messages, a server must calculate the final outcome that an end-user will see and only publish if this changes. A new observation therefore is published whenever the minimum and maximum count-down (now - otl:minEndTime/otl:maxEndTime) in seconds or the otl:signalPhase changes. This results in the generation of one iGraph per second.
There are two main strategies to publish live data: a publish/subscribe system where an iGraph is pushed to the client and HTTP polling where the client pulls a Linked Data Fragment repeatedly. The data publisher must offer HTTP polling and should offer pub/sub:
- HTTP polling: a Linked Data Fragment which is a HTTP document containing one or more of the most recent iGraphs (e.g. https://lodi.ilabt.imec.be/observer/rawdata/latest). The ETag header must be added to indicate if the content has changed so HTTP caching is possible. This ETag can be generated by hashing (e.g. MD5) the fragment or the latest iGraph.
- publish/subscribe: every update corresponds with one iGraph like Fig. 2. Preferably, HTTP-based Server-Sent Events should be chosen.
Historical data are published as Linked Data Fragments similar to the HTTP polling approach. Fig. 3 shows that all observations are ordered on a time axis: the Linked Data Fragments select data based on time ranges. The historic fragments should have a cache-control header set to immutable instead of using an ETag header. To allow a HTTP client to automatically discover older observations, a hydra:previous hypermedia link must be added using the Hydra vocabulary. Hydra:next links should be added to allow time range retrieval in both directions. Also, the URL of the fragment is identified using the datetime of its first observation (e.g. https://opentrafficlights.org/spat/K648?time=2018-10-31T14:58:23.205Z).

Fig. 3: Timeseries are published as a paged collection of time sorted Linked Data Fragments.
Another feature that the interface should expose is templated links: a client should be able to construct a URL to retrieve the fragment that contains observations around a certain time parameter. Fig. 4 gives an example on how to express this hypermedia control. The server must redirect with a HTTP 302 status code to the fragment whose time range encapsulates time. When missing, the last fragment is returned. With the templated links hypermedia control, Open Data reusers don’t have to crawl through all the fragments to fetch observations between a certain time range. Technically, templated links can replace pagination hypermedia links, but these links are necessary to lower the barrier for Open Data reusers such as regular Web crawlers [9].
{"@id": "«currentPageURL»","@type": "hydra:PartialCollectionView","hydra:search": {"@type": "hydra:IriTemplate","hydra:template": "<<baseUrl>>{?time}","hydra:variableRepresentation": "hydra:BasicRepresentation","hydra:mapping": {"@type": "hydra:IriTemplateMapping","hydra:variable": "time","hydra:required": true}}}
Fig. 4: A client can search for observations with a datetime as input parameter.
Finally, following metadata must be added to every fragment:
- the topology of the intersection (MAP): when available, the identifiers of the lanes of the local authorities should be reused. Otherwise, a lane should be defined using otl:Lane and use http://purl.org/dc/terms/description and http://www.opengis.net/#geosparql/wktLiteral so user agents can discover which travels are possible and on which signal group this depends (otl:signalGroup).
- an Open License (cfr. CC-0, CC-BY etc.) is needed so the data complies under the Open definition and that reusers can check whether its intentions with the data are in line with the legal terms
In next section, a method will be proposed for long-term preservation of these fragments.
Preservation strategy
With our specification, one observation with the average size of 7 kilobytes is published every second which generates more than a half gigabyte per day. It is important that inactive data is removed from the Open Data server to keep it light-weight, however, these should still be available for retrieval.
As discussed in the background, tape is cost-efficient for large files. To preserve the published fragments, which are relatively small, on tape a different approach than disk storage is required. To circumvent this, Linked Data Fragments can be merged into one bigger Linked Data Fragment. This means that not the exact bytes are preserved, but only the RDF statements. On the one hand, when there are no blank nodes used in the statements, it is easy to check whether the merged fragment contains all the statements of the original fragments. On the other hand, when there are blank nodes, the merged fragment needs to rewrite the original blank nodes so these remain locally unique. For disk archives, there is no need to create bigger files, thus archiving can be done traditionally as explained in section 2.
There are four aspects on synchronizing archives with our specification for traffic lights data (Fig. 5):
- archives need to harvest and optionally merge the Linked Data Fragments by following the provided hypermedia links in the Linked Open Data interface
- a hypermedia link is added to its previous harvested fragment
- an access URL is exposed by the archive that redirects to the latest harvested fragment
- the last published fragment of the Linked Open Data interface links to this access URL so the archive becomes an extension

Fig. 5: An archive can harvest the historical observations, optionally merge the Linked Data statements of multiple documents into one document, and link everything together through previous links.
Demonstrator
This application shows live traffic lights data of the intersection in Antwerp. The source code can be found as a Codepen at https://codepen.io/brechtvdv/pen/BMQPNX/. The dataset is freely available under an Open License at https://lodi.ilabt.imec.be/observer/rawdata/latest.
First, a user can select a departure and arrival lane, indicating how the intersection will be crossed. The departure and arrival lane describe an otl:Connection that can be selected from this information. A live count-down of the traffic light that is responsible for the chosen otl:Connection is shown. The count-down is calculated with the minimum ending time of the state (current time - otl:minEndTime). The bigger then ‘>’ sign indicates that the minimum and maximum end time are not equivalent, thus it is uncertain when the signal state ends. Note that this application uses HTTP polling every 100 milliseconds.
Underneath the count-down, a historic ‘time-to-green’ is shown. The line chart represents how many seconds a user had to wait before getting a green light. The horizontal lines correspond with a waiting time of 0 seconds, and thus corresponds with a green light.
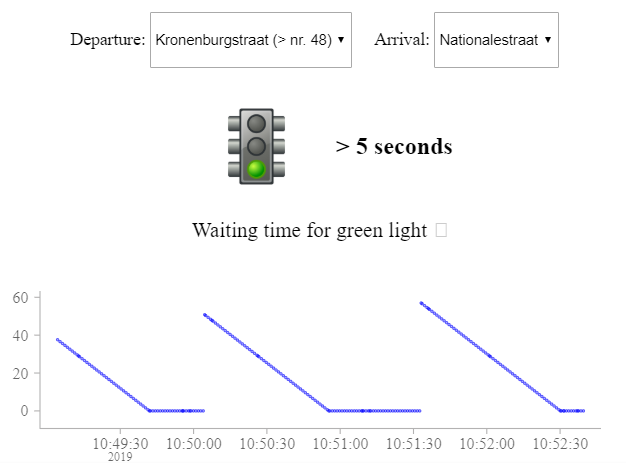
Fig. 6: Visualisation of the live count-down and the amount of seconds to wait before having a green light. Notice that the horizontal lines correspond with green times.
See the Pen Time to Green by Brecht Van de Vyvere (@brechtvdv) on CodePen.
Conclusion
Cities can use the Open Traffic Lights ontology to publish their traffic lights data in a semantically interoperable way. A TCS Open Data interface following the proposed specification publishes every second one update. This lowers the barrier for Open Data re-users to create visualizations on top of it: they only have to retrieve the latest observation as fast as possible. Still, it is possible to create a more intelligent client that calculates a client-side count-down. While this can improve the user experience, another information resource would have to be created to inform about priority updates (such as when an ambulance or police car influences the plan of the TCS).
This early work is open to feedback from other cities that want to publish TCS data. In earlier work, we proposed a Linked Times Series interface [5] as part of the publishing strategy for Flanders. In this paper, archives are able to download the historic data of cities through its hypermedia links, and optimize storage for tape storage. By linking the archived fragments in a similar way the archive is activated as an Open Data extension of the interface. In future work, we will work on improving the discoverability of traffic lights datastreams by applying the Semantic Sensor Network [10] and the Vocabulary and Catalog for Linked Streams [11] ontologies. Also, we will explore how Memento TimeMaps compare to our time sorted Linked Data Fragments solution. Furthermore, we will benchmark HTTP polling versus publish/subscribe to have a better understanding how the speed of sensor observations impacts the server infrastructure needed to guarantee and acceptable end-user latency for the live updates.