Introduction
The city of Antwerp invested during 2018 in connecting the traffic lights of an intersection to the Internet. With the Open Traffic Lights project [1], the data about the phase and timing of these traffic lights have been made freely available on the Web as Linked Open Data. Typically, this is used for Green Light Optimal Speed Advisory (GLOSA) [2] systems to save fuel through speed advice or count-down timer [3]. While GLOSA systems focus on the event of approaching an intersection, route planners have a more global view of the user journey where fuel savings can be one parameter. Implementing live changing data like these in traditional origin-destination route planning APIs would require much more complex tasks such as permanent tracking of the user.
Recently, work has been done on serverless route planning over public transport timetables [4] and road networks [5] performing the route planning algorithm on the client-side. This appproach makes the client free to choose how it runs its route planning queries while data owners are only reponsible for publishing its data in an interoperable way. Such a client (cfr. Planner.js) can be extended to not only query over road networks, but also take traffic lights data into account. In the Netherlands and Belgium, dynamic traffic lights are installed which change their current phase duration according to detectors (pedestrian counters, cameras etc.). This introduces new challenges [6], such as forecasting how long the current phase will likely take. In the Netherlands, opposed to the standard SPAT, it is mandatory to calculate and publish this on the server-side, while in Belgium only the minimum and maximum duration is expected to be published. In this article, we investigate how the current phase duration of the traffic lights in Antwerp can be predicted and demonstrate this on the client-side.
Predicting the phase duration
To be able to predict the phase duration of a dynamically changing traffic light phase, there are two steps we take: first, we create frequency distributions [7] of phase durations for every signal group and then we predict the duration for every signal phase and timing (SPAT) update by using a selector on the distribution that is applicable for that update. Since traffic patterns can change depending on the time of the day or day of the week, we grouped signal phases by applying multiple strategies [9]. As a baseline, frequency distributions are created for every signal group and signal phase. Then we grouped phases according to their type of day (weekday or weekend) and in time slots of every hour. The reasoning behind this is that a traffic light interacts differently during the weekends and peak hours. As last strategy, we grouped per day (Monday, Tuesday…) and in time slots of 20 minutes. To predict the duration of a phase from a received update, we tested a few basic selectors: median, mean and mode. These selectors only consider phase durations that take longer than its current duration, because these are still historically possible to occur. We chose these selectors instead of graph transformations [8], because we discovered that certain phase durations of our tested dataset occur more frequently than others, which creates peaks in its frequency distribution. This made us hypothesize that this behavior will benefit using a method like the mean. Finally, to express the prediction error we calculate the mean absolute error (MEA) for every SPAT update as follows [7] where is the predicted duration and the real duration of : .
Results
We used traffic lights data from the intersection in Antwerp which contains SPAT updates of 8 dynamically changing signal groups. To run reproducible tests, we harvested a dataset from 8th till 25th March 2019 from the OTL endpoint containing 50951 historical fragments. The test cases are ran using 10-fold cross validation. First, we extracted the SPAT updates from the fragments and randomly divided these in 10 groups. Then we replayed every update , who belongs to one group, and predicted its duration using the frequency distributions made from the other 9 groups and compared it with its real duration . Only updates with unknown duration (minimum and maximum duration differ) are considered.
Table 1 shows the MAE for every grouping strategy and method we applied. We see that fine-grained grouping of phases improves the MAE which acknowledges related work [9]. Also, using the median returns lower prediction errors than the mean and mode. A very good result is considered around 2s according to Bodeheimer et al. [9], but for a basic algorithm, an input variance of approximately 133s and without using external detector information an overall MAE of 5.1s is still lower than expected. Especially because this test also considers updates whose time till phase change is very high (above 30s).
| Method | No grouping (s) | Per type of day and every hour (s) | Per day and every 20 minutes (s) |
|---|---|---|---|
| Median | 6.8 |
5.5 |
5.1 |
| Mean | 7.0 |
5.9 |
5.6 |
| Mode | 7.6 |
6.2 |
6.0 |
Table 1: An overall prediction error of 5.1s is good, because a prediction is made for every SPAT update without using external datasets. This hints that some dynamic traffic lights of Antwerp probably follow a predictable pattern which is feasible for path planning algorithms.
To test this causality between the MAE of a signal group and its time until phase change, we plotted this in Fig. 1 for one signal group showing signal phase “Stop and remain” (red line) and “Protected Movement Allowed” (green line). The other signal groups can be found at https://kridhaen.github.io/OpenTrafficLightsDistributionsVisualizer/ by pressing the arrow button to “Visualization of the prediction error for each time to phase change for large dataset”. With these graphs, a user can compare the predictability of certain signal group and phase combinations. The signal phase “Protected Movement Allowed” (green line) shows a prediction error of almost 0s which can be confirmed with its frequency distribution: its phase duration generally takes 15s and exceptionally 18s. With this knowledge, route planners can safely assume that this signal group will have a green time of at least 15s. For the signal phase “Stop and remain” (red line), we see three findings. First, between 0s and 9s there is no prediction error, because the minimum duration equaled the maximum duration. Next, we see a flat line for phase durations between 9s and 65s with a MAE around 10s. Although we don’t know the exact distribution of the errors, a route planner needs to be aware that the prediction is on average this much off so it must do a best-effort to minimize the consequences for the driver. For example, when the phase is 60s before change: on the one hand a prediction of 50s can lead to 10s of waiting before a red light, on the other hand a prediction of 70s means that it is already 10s green with 5s remaining. This raises a new challenge whether the driver will be able to pass the green light in those 5s depending on the crowdedness. Lastly, above 65s the prediction error grows linear. Although these long phase durations occur exceptionally, otherwise the overall MAE would be much higher, route planning during such a phase would return completely unreliable results.
Fig. 1: Predicting the duration of signal phase “Protected Movement Allowed” (green line) for this signal group is perfectly possible as its prediction error is almost 0s. For signal phase “Stop and remain” (red line), we deem a prediction error around 10s still valuable for route planning.
Demonstrator
This Web application demonstrates the prediction of the current phase duration of a live traffic light in Antwerp. This gives implementers of route planning engines better insight how traffic lights data work and how its reusability increases by applying prediction methods. The green, red and blue line on the chart shows respectively the minimum, maximum and predicted duration in seconds of the phase. On the client-side the latest data from the Open Traffic Lights API gets harvested and frequency distributions are constructed with the same strategy as Section 4. This vizualization shows us that the minimum and maximum duration can differ tens of seconds, especially in the beginning. Also, when the minimum and maximum duration align, and thus it becomes certain how long the phase take, the blue line gets mostly corrected with a few seconds. This behavior hints to our result from the mean prediction error (Table 1). The source code is available at https://codepen.io/kridhaen/pen/VJrezO/.
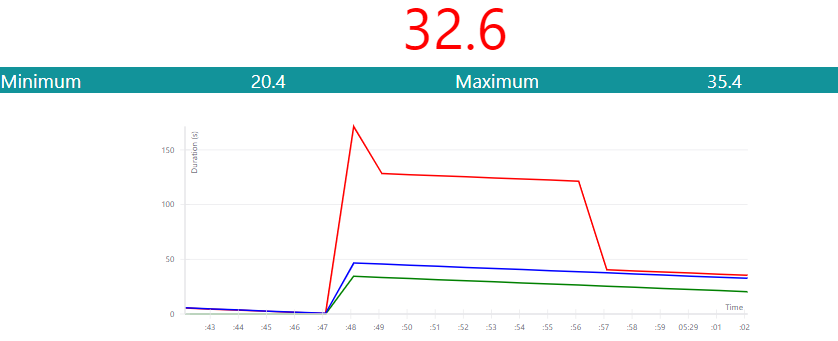
Fig. 2: The blue line shows the predicted phase duration which gives a better understanding how this relates to the minimum (green) and maximum (red) phase duration and whether it was a good prediction in the end.
See the Pen OpenTrafficLightsPredictor by kridhaen (@kridhaen) on CodePen.
Discussion
A route planner can predict a fixed phase duration, e.g. the phase will probably last 20 seconds, with a frequency distribution and selector like the mean, but can it anticipate on the error this prediction brings? By transforming the frequency distribution to a cumulative frequency distribution, routing with a fixed probability is possible. For example, when 90% of historical phase durations happened before a certain duration, then a route planner can be 90% sure that the phase will change before that time. This fixed probability can be configured as a user preference and also gives the possibility to cut off the exceptionally long phase durations from the time until phase change curve (Fig. 1). Consequently, a route planner can retrieve the maximum MAE from the left-side part of the curve to have an indication of how much the predicted duration can be averagely off and anticipate with it, e.g. will the driver still be on time for a green light or is there another route with less waiting time for a red light? Also, the maximum MAE can be configured by the user to better fit their expected routing accuracy. As a first discussion point (i), we would like to discuss whether a user should be able to configure a minimum probability or leave this responsibility to the data publisher, like in the Netherlands. In future work, we suggest to also use a frequency distribution for the variance of prediction errors instead of only calculating the MAE value. Whether a predicted phase duration is usefull depends on several factors, such as the crowdedness in the streets. When it is very crowded, we deem data about travel times between points more usefull than traffic lights data, because the driver does not have the flexibility to time its arrival at an intersection. Finally, related work [9] has already demonstrated that having access to all detector information lowers the prediction error significantly. This brings us to our second discussion point (ii): what would enable a better description of how a traffic light is connected with other sensors in the broader context of a city (cfr. Digital Twin)? As a next step, we will publish a live vehicle counter dataset from the intersection in Antwerp as Linked Open Data and reuse this for lowering the prediction error.